Victory Capital Holdings (VCTR)·Q4 2025 Earnings Summary
Victory Capital Beats on EPS and EBITDA as Amundi Integration Nears Completion
February 5, 2026 · by Fintool AI Agent
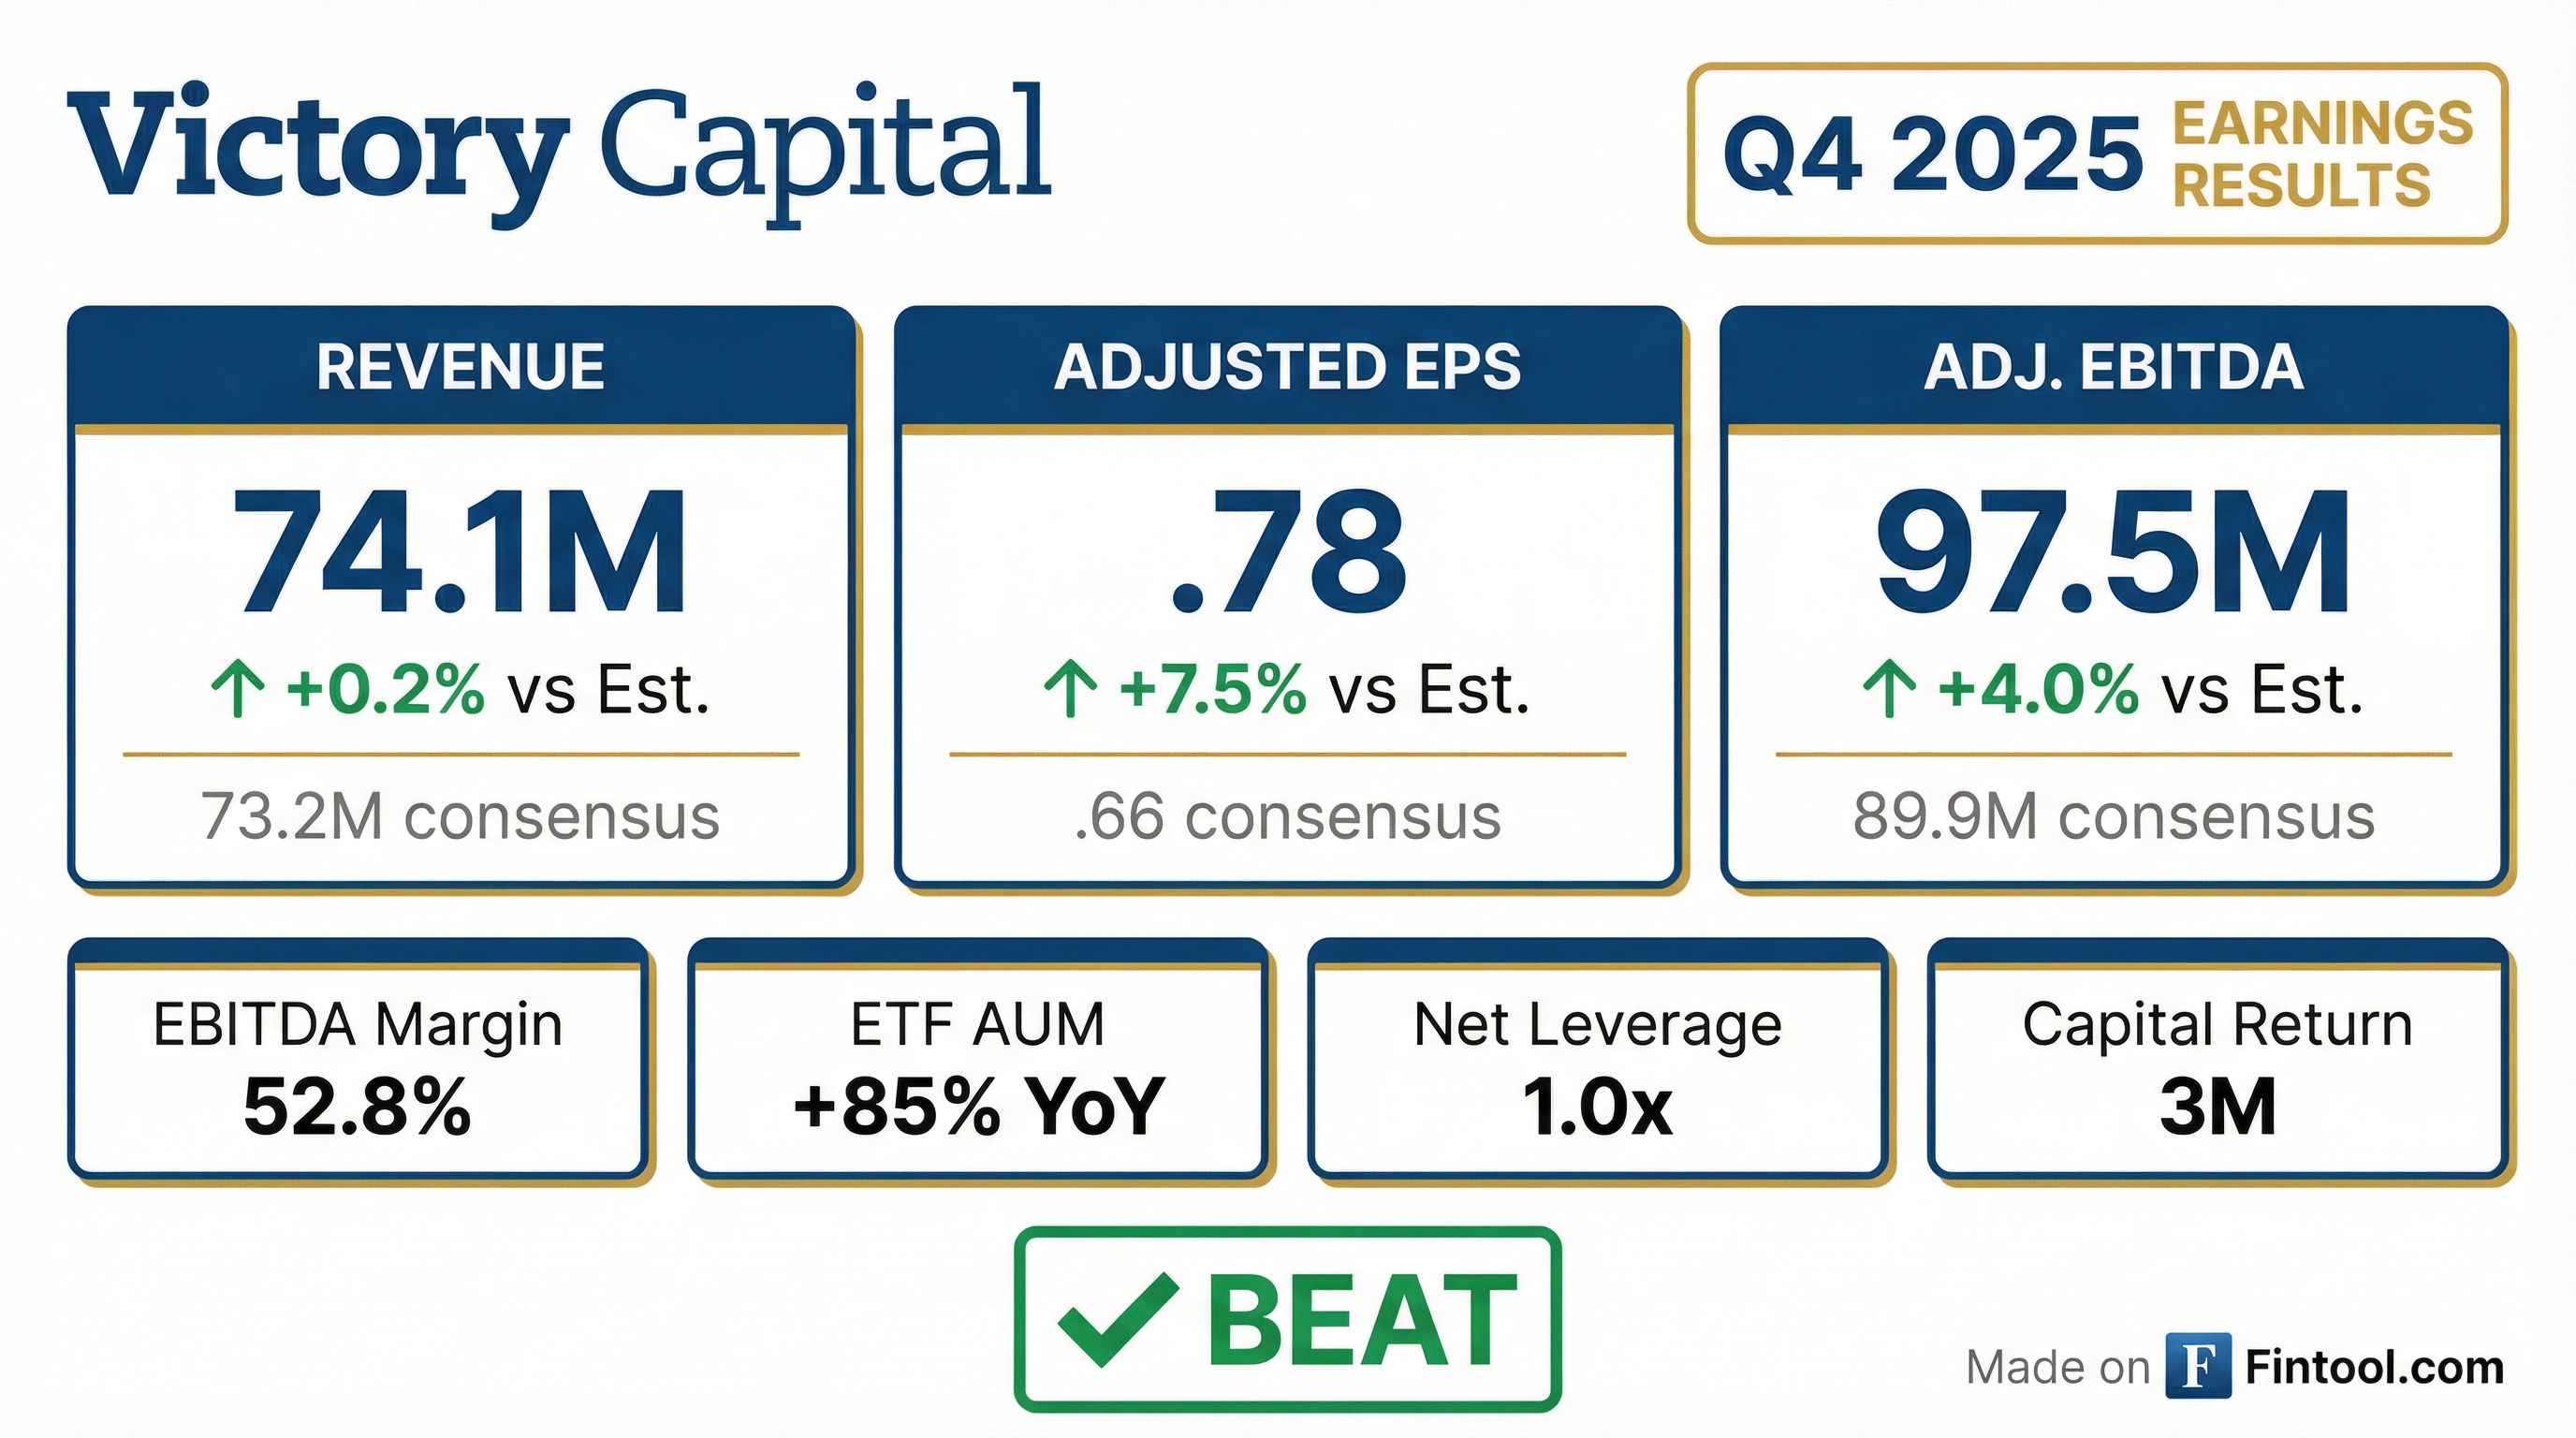
Victory Capital (VCTR) delivered a strong Q4 2025, beating adjusted EPS consensus by 7.5% and EBITDA by 4% as the asset manager completed a record year across every key financial metric. Total client assets reached $317 billion while adjusted EBITDA margin held at 52.8%, demonstrating operating leverage from the near-complete Amundi integration.
Did Victory Capital Beat Earnings?
Yes — beat on EPS and EBITDA, in-line on revenue.
This marks Victory Capital's sixth consecutive EPS beat. The company's trailing 8-quarter beat/miss record:
*Values retrieved from S&P Global
How Did the Stock React?
VCTR shares closed at $70.98 on February 4, up 2.9% ahead of the after-hours earnings release. The stock is up 10.7% YTD and +10.8% over the past year.
Historical earnings reactions (1-day move):
Stock reactions have moderated despite consistent beats, suggesting the market may now be pricing in continued execution.
What Changed From Last Quarter?
Key sequential improvements (Q4 vs Q3 2025):
Year-over-year (Q4 2025 vs Q4 2024):
- Revenue: +61% ($374.1MM vs $232.4MM) — driven by Amundi acquisition
- Adj. EPS: +23% ($1.78 vs $1.45)
- Total Assets: +65% ($4.2B vs $2.5B)
What Records Did Victory Capital Set?
Full-year 2025 achieved all-time highs in:
- ✓ Gross Sales — $17.1B in Q4, highest quarterly level in company history; sixth consecutive quarter of higher gross sales
- ✓ AUM — $317B in total client assets at year-end
- ✓ Revenue — Surpassed $1B annual revenue for first time
- ✓ EBITDA — Record $197.5MM quarterly adjusted EBITDA
- ✓ Earnings Per Share — Record $1.78 quarterly ANI EPS with tax benefit; 21% CAGR since IPO
- ✓ Cash Flow — Generating more cash than ever before
*FY 2025 calculated from quarterly results. Values retrieved from S&P Global.
How Is the Amundi Integration Progressing?
The transformative Amundi acquisition has reached the finish line:
Synergy Achievement: $97MM of targeted $110MM in net expense synergies realized (88% complete), on track to hit full target during 2026 — ahead of original timeline.
International Scale:
- 17% of AUM now from international clients across 60 countries
- Pioneer Investments net-flow positive in each quarter since acquisition close
- Investment performance at Pioneer has remained steady or improved under Victory ownership
UCITS Product Expansion:
- 5 new UCITS launched in Q4 for international distribution
- 3 managed by RS Global and RS Value investment teams
- 2 managed by Pioneer Investments
- More UCITS launches planned for 2026
Distribution Power:
- 15-year exclusive distribution agreement with Amundi
- Access to 1,000+ institutional clients
- 600 third-party distributors
- 200 million retail client access via Amundi's networks
- Sales force integration complete; training done, teams are set
What's Driving ETF Growth?
The VictoryShares ETF platform continues to outperform:
Major Platform Wins:
- Morgan Stanley Wealth Management: VictoryShares Core Intermediate Bond ETF (UITB) and Short-Term Bond ETF (USTB) became first active fixed income ETFs on the focus list
- Merrill: VictoryShares Free Cash Flow ETF (VFLO) highlighted as top-rated quality ETF in single-factor subcategory
- Wells Fargo, RBC, LPL: USTB earned recommended list status
Flow consistency: Free cash flow ETF series generated positive net flows every single month in 2025, while active fixed income ETFs also produced strong inflows throughout the year.
Distribution initiatives underway:
- Amundi's sales force began selling U.S.-listed ETFs overseas at start of 2026
- New platform placements and home office recommendations
- Commenced selling U.S.-listed ETFs across Asia
- Dedicated ETF salesforce deployed
- Additional product launches planned for 2026
What Is Victory Capital's Investment Performance?
Strong track record across time horizons:
Investment performance remains a core differentiator, with nearly 8 in 10 strategies outperforming over a decade.
How Is Capital Being Deployed?
Q4 2025 Capital Return:
- Repurchased 814,000 shares at avg price of ~$63/share ($51.6MM deployed)
- $93MM total returned to shareholders in Q4 (buybacks + dividends)
- Full-year capital return: $366MM
- Quarterly dividend: $0.49/share, payable March 25 to shareholders of record March 10
- $300MM+ remaining capacity under $500MM buyback authorization
Balance Sheet Strength:
- Cash: $164MM
- Debt: $983MM (Term Loan B at SOFR +200bps)
- Net leverage: 1.0x — lowest since IPO
- $100MM revolver undrawn, extended to 2030
- Term Loan B maturity pushed to 2032, saving ~$3.5MM annually from 35bps rate reduction
Since IPO, Victory Capital has returned $1.2 billion to shareholders through dividends and buybacks.
What Did Management Say About M&A?
CEO David Brown was bullish on the acquisition opportunity set:
"I could not be more encouraged about the acquisition opportunity set. The exact timing of an acquisition is always hard to predict, and patience is an asset when sourcing and diligencing opportunities. That said, our cadence of executing quite frequently has been consistent over the last decade plus, and I see no reason for that to change."
Key M&A takeaways from Q&A:
- Victory is "the busiest we ever have been" from an acquisition standpoint
- Industry consolidation pressures are becoming "more pronounced"
- Historical M&A cadence: one acquisition every 1.5 years since 2013 management buyout
- Ready to execute with "size and scale" — preference is for larger deals
- Balance sheet at lowest leverage since IPO supports inorganic growth
- Will buy back stock "even more aggressively" while working on next transformational acquisition
Q&A Highlights
On UCITS and International Flows (Bank of America):
- 5 new UCITS launched in Q4; more planned for 2026
- Impact from new launches will build toward end of 2026
- International channel has been net flow positive since April close
- Will be "launching a lot more product into the system" over coming years
On ETF Platform Partnerships (J.P. Morgan):
- Partnerships with platforms are "super important for the future" and will become "table stakes"
- Victory prefers partnerships with "more of a selection perspective" — limited set of managers
- Existing relationships make it "much easier to introduce new products" including private markets
- Similar to mutual fund platform partnerships but with "unique characteristics" for ETFs
On Won-But-Not-Funded Pipeline:
- Strong pipeline spanning multiple franchises and distribution channels
- Most mandates expected to fund during H1 2026
What Are the Key Risks?
Identified risk factors from disclosures:
-
Market-driven AUM volatility — Geopolitical conflicts (Ukraine, Middle East, China/Taiwan), tariffs, and market corrections directly impact fee-generating assets
-
Net outflow pressure — Q4 net long-term flows were -$2.1 billion, an off-trend quarter driven by: one large platform redeeming ~$1 billion from one strategy, plus year-end client reallocation redemptions (clients still have sizable accounts and remain Victory clients)
-
Fee compression — Average fee rate of 47.4 bps remains under industry pressure
-
Key person risk — Dependence on retaining senior investment professionals
-
Integration execution — Final $13MM of synergies still to be realized
What's the Outlook?
Forward Consensus Estimates:
*Values retrieved from S&P Global
Key catalysts ahead:
- Complete remaining $13MM in Amundi synergies
- Additional ETF product launches in 2026
- Potential M&A — focus area is firms with $10-200B AUM ($11.1 trillion opportunity set)
Financial Summary
Source Documents: Q4 2025 Earnings Presentation | Victory Capital Investor Relations